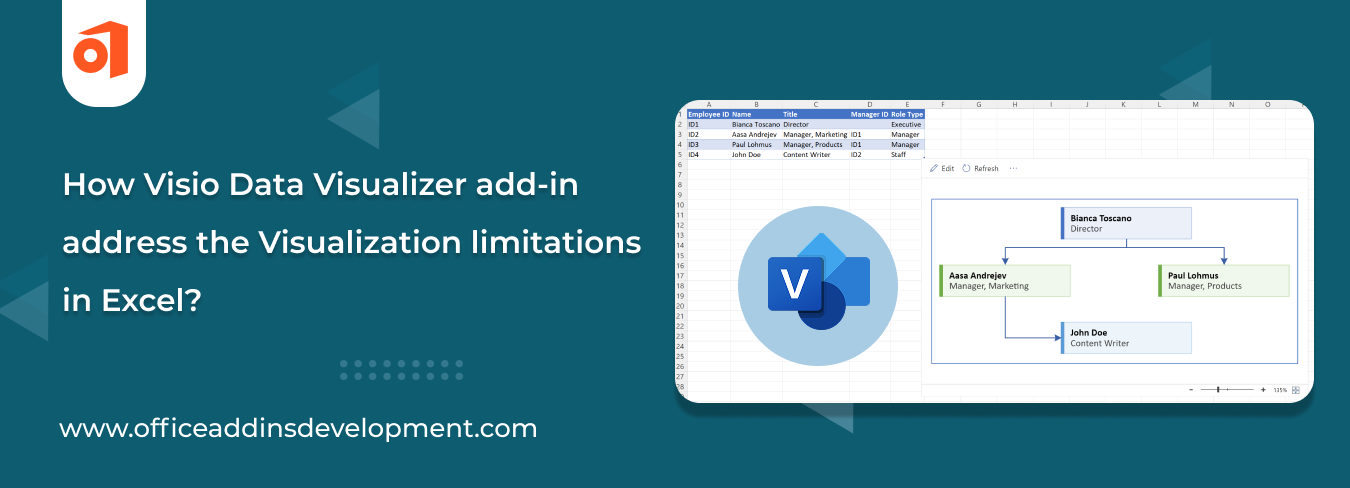
Let’s say you’re a project manager, managing your team and the workflow of a complex project. You begin by arranging tasks and timelines in Excel. It's neat and well structured, but when it is time to share or present the information to the teams, the rows and columns never tell the story well.
This is where the Visio Data Visualizer Add-in steps in to turn your Excel data into dynamic, professional diagrams that speak louder than words.
In this blog, we will discuss the Visio Data Visualizer Add-in and explore how it solves Excel's visualization problems.
Visualization Limitations in Excel
Excel is a powerful tool for managing data, while there are restrictions when it comes to visualizing complex information, which can work against clear and efficient presentation.
1. Challenges with large datasets
When there are large volumes of data in Excel, it becomes difficult to manage and read. One may lose sight of something important while scanning a long-lined table. Extracting patterns or trends can somehow take a long time.
2. Lack of real-time updates leads to static visualizations
While working on datasets, sometimes one goes on editing data in Excel, but in certain instances, charts won't update columns formed by genuine output processes unless done manually, taking up your precious time. In this way, your charts might show outdated or wrong information during meetings or for reports contrary to expectations.
3. Excel lacks customization since it has basic chart types
Excel can only create simple chart types like pie charts and bar graphs. It cannot offer flowcharts or organizational charts. And you have almost no way whatsoever of customizing such charts. So it is difficult to create appealing and clear visuals for complex ideas.
4. Limited Collaboration
Working together in Excel can be difficult. When a file is handled by several people, it becomes tough to even know who has made the changes. Consequently, this causes mix-ups, misunderstandings, and errors on behalf of the one who has mistaken any detail.
5. Lack of Auto-sync
One has to manually update visuals in Excel. If the figures change, the charts will not change unless one fixes them. These would be some types of errors that end up consuming one's time.
To get rid of these challenges, we require Excel add-ins that solve data analysis challenges. Visio Data Visualizer could be the best solution here.
How the Visio Data Visualizer Add-in Adds Value
Now, what does this Visio Data Visualizer Add-in do, and what is its purpose? So, to put it simply, this Visio Data Visualizer Add-in operates as a tool inside Microsoft Excel; it is an interface for users as it converts structured spreadsheet data into professional-grade Visio diagrams: flowcharts, cross-functional flowcharts, and organizational charts, all from Excel.
Before, the idea was that users could have a simple visualization of complex data against processes without having Visio fully installed on the desktop.
For Microsoft 365 users, it provides real-time generation and updating of diagrams, which is useful in analyzing workflows while enhancing collaboration and presenting the data in a nice, clear, and attractive manner.
Manage your company data with custom Google Sheet Add-ons
1. How does it make Excel more effective?
The benefits provided by the Visio Data Visualizer add-in for Excel are great if a user wants to quickly convert structured data into attractive flowcharts, organizational charts, or process diagrams without having Visio installed.
Using a prefixed table, users can input or edit process steps, and the diagram reflects those changes in real time. This integration allows complex workflows to be visualized in Excel itself, providing better clarity and saving time. It supports live collaboration and editing via Microsoft 365.
How Visio Data Visualizer Add-in Solves Excel’s Limitations
The Visio Data Visualizer Excel add-in is a way to overcome the processing limits of usual Excel visuals by turning static data into interactive and professional diagrams.
1. It converts tabular data into structured visual formats
Using this Microsoft Visio Data Visualizer Add-in for Excel, you can create diagrams from your row and column data. Assists in flow charts, organization charts, or process mapping within minutes, hence making the integration among processes visible to your working group.
2. Visio Addin enhances your Data analysis capabilities
When looking through charts, it becomes easier to identify bottlenecks or delays in the process. The Excel Data Visualizer add-on allows you to understand and delve into the data much more quickly. It gives you a clearer picture rather than an endless series of numbers.
Hire Office Add-ins Developers to Build industry-specific solutions
3. It keeps diagrams updated with live data links
Once Excel data changes, the diagrams will reflect those changes as well. Conversion of the diagrams through updates is no longer something you have to do. The auto-sync feature saves you plenty of time and prevents you from making mistakes. Your visuals always display data in its most current form.
4. It offers professional formatting and structure control
Visio Data Visualizer makes it possible for you to generate clean and aesthetically pleasant diagrams. Customize everything: color, shape, and layout. Data presented in an elegant visual format is simple to understand and can be used right away in reports and presentations.
5. Visio Add-in allows collaboration and export via OneDrive/SharePoint
OneDrive or SharePoint is used to store and share your diagrams. In this way, team collaboration becomes easier. Everyone sees and edits the same version.
Compatibility and Requirements for the Visio Data Visualizer Add-in
-
Supported Excel Versions
The Visio Data Visualizer Add-in works with Excel 2016 or later and is fully supported inside Excel for Microsoft 365 (formerly Office 365). It plays well with desktop Excel and Web versions of Excel bundled under Microsoft 365 subscriptions.
-
Microsoft 365 Account Requirement
To use this add-in, you need to sign in with your Microsoft 365 Work or School account. There is no support for Microsoft personal accounts.
-
Browser Compatibility (for Web Access)
For Web Access, while using Excel Online, supported browsers include Microsoft Edge, Google Chrome, and Safari.
Improve your team collaboration with MS Teams Add-ins Development
-
Visio Licensing
A desktop license for Visio is not needed to use the add-in for basic features. However, for more editing or customization features on the web, the user is required to subscribe to either Visio Plan 1 or Visio Plan 2.
-
Platform Support
Windows: Microsoft 365 Excel is fully supported on the web and desktop versions.
Mac: Works in Excel for the web but has limited support on the Excel desktop version for macOS.
Mobile Devices: Insert or edit support is either limited or unavailable.
So that’s how Excel Visio Data Visualizer Add-in solves the limitations of Microsoft Excel. We hope you find this article helpful. In case you want to customize any Office 365 Add-in, reach out to us.
Excel Visio Data Visualizer Add-in - Conclusion
With the Visio Data Visualizer add-in, Excel has set a new standard for data visualization. Whereas Excel organizes the data and carries out the analysis, it cannot portray complex mechanisms. Visio produces clear graphical diagrams from Excel tables, such as flowcharts and process maps, which are then easily understandable and shareable.
The integration thereby provides enhancements to the situation, encourages collaboration, updates visuals in real-time, and creates presentation-ready Excel diagrams, placing them where teams can make better decisions.
Looking to modify Excel Add-ins for your data displays? Contact us to get the best out of our Excel Add-in development services. We help you enhance Excel's functionality with personalized add-ins that save you time and improve your productivity.
FAQS on Visio Data Visualizer Add-in for Excel
1. Is the Visio data visualizer add-in free?
The basic features of the Visio Data Visualizer Add-in may be used for free, but the advanced features require a Visio subscription.
2. How to add the Visio data visualizer to Excel?
To add the Visio data visualizer, click on the Insert tab, then select Get Add-ins and search for data visualizer. Accept any security prompts to trust the add-in, then sign in using your Microsoft 365 account.
3. How to convert raw data into graphs?
You can choose the type of diagram, link the data, and then make a graph that adapts to any changes in the data using the Microsoft Visio Data Visualizer Add-in.


 Inquire